Don't miss our holiday offer - 20% OFF!
Read Also : How to Build a Real-Time IoT Monitoring System with Flux
In the digital industrial era, the ability to monitor data quickly and accurately has become one of the key factors in improving operational efficiency. Companies can no longer rely on conventional methods to manage data, especially as the number of devices and the volume of generated information continue to grow.
The Internet of Things (IoT) has opened significant opportunities for automatically collecting data from various devices. However, without an effective visualization system, this data can be difficult to understand and utilize optimally. Therefore, dashboards have become an essential component in the IoT ecosystem.
Flux Dashboard is designed as a solution that enables companies to monitor IoT data in real time, accurately, and in an integrated manner. With its intuitive interface and comprehensive features, this dashboard helps users understand operational conditions more quickly.
This article will discuss the various advantages of the Flux IoT Dashboard in supporting real-time and accurate data monitoring in modern industries.
Contents
Informative Real-Time Data Visualization
Read Also : IoT System Integration Guide with Flux to Improve Industrial Efficiency
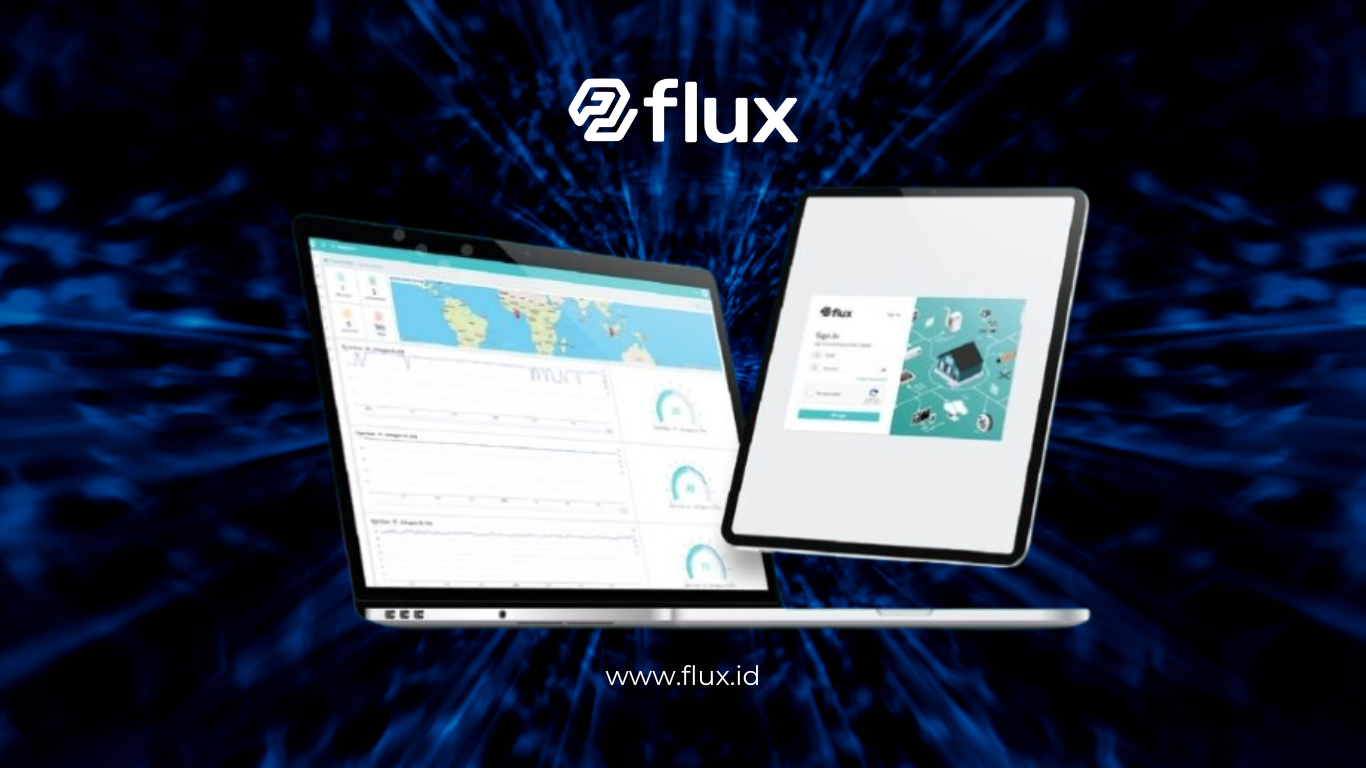
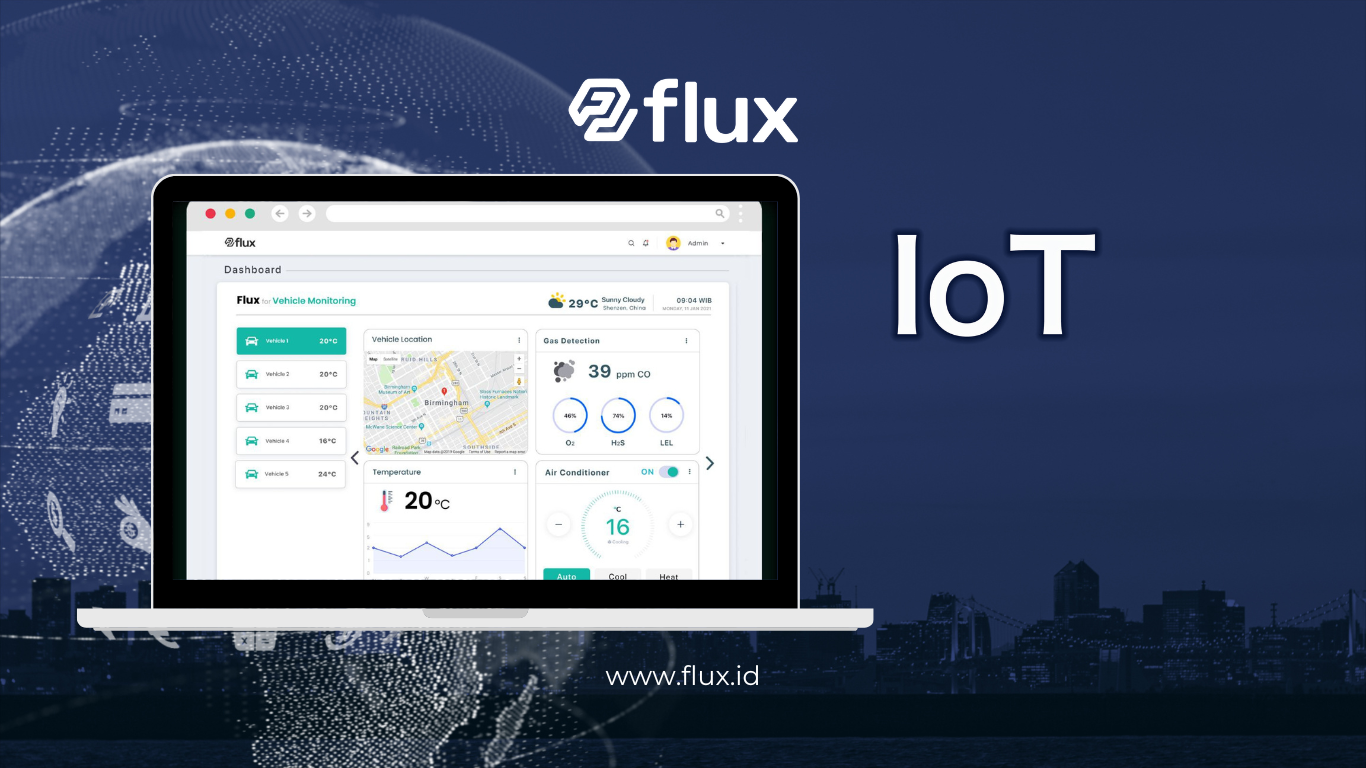
One of the main advantages of the Flux Dashboard is its ability to display data in real time. Data from various IoT devices can be instantly visualized in the form of graphs, tables, and performance indicators.
This visualization helps users understand operational conditions without having to process complex raw data. For example, changes in temperature, pressure, or energy consumption can be easily observed through clear and intuitive graphs.
With informative visualization, users can quickly identify changes and take necessary actions. This is especially important in industries that require rapid responses to dynamic conditions.
Additionally, the dashboard can be customized to meet specific needs, allowing users to focus on the most relevant data for their operations.
Data Integration from Multiple Sources in One Platform
Read Also : Flux Gateway: Strengthening IoT Device Connectivity and Integration
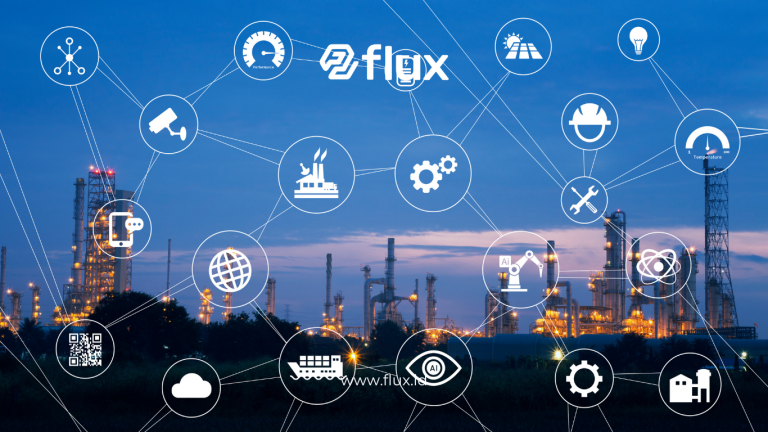
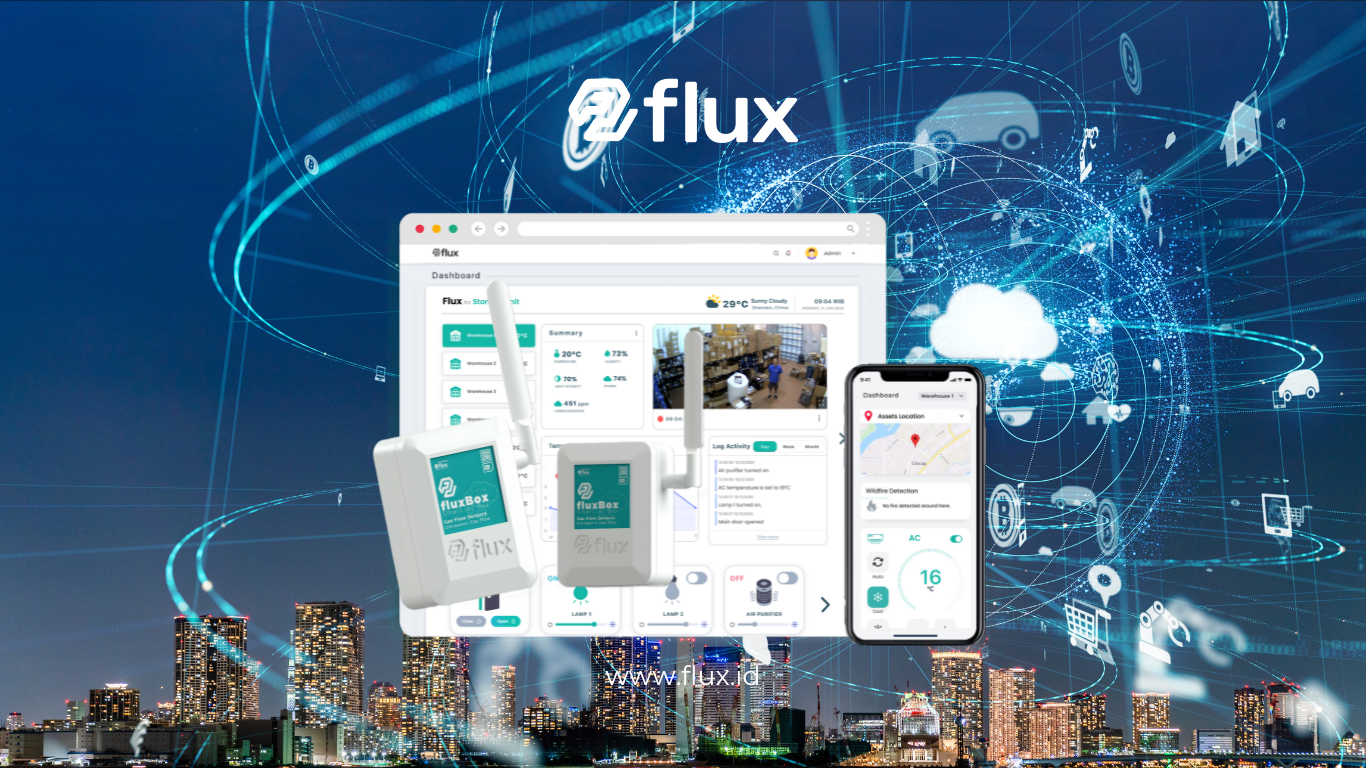
The Flux Dashboard enables the integration of data from multiple sources into a centralized platform. In industrial operations, data typically comes from various devices such as sensors, machines, and management systems.
Without proper integration, this data would be scattered across different systems, making it difficult to analyze comprehensively. With the Flux Dashboard, all data can be consolidated and displayed in a single interface.
This integration provides a more complete operational overview and improves coordination between teams. Users no longer need to switch between systems to access the required information.
Furthermore, integration increases work efficiency, as data flows automatically without the need for manual input.
High Data Accuracy for Better Decision-Making
Read Also : Economic and Environmental Advantages of Smart Hydrofarming
Another key advantage of the Flux Dashboard is its high level of data accuracy. The data displayed comes directly from IoT devices and is updated in real time, reflecting actual field conditions.
Accurate data is essential for decision-making. With reliable information, management can make more effective decisions and reduce the risk of errors.
The Flux Dashboard also includes data validation features to ensure that the displayed information matches real conditions. This is crucial for maintaining system reliability.
With accurate data, companies can improve operational quality and achieve higher efficiency.
Automatic Notifications and Alerts for Faster Response

Read Also : How to Use Flux for IoT Data Monitoring and Digital Operational Transformation
The Flux Dashboard not only functions as a monitoring tool but also as an early warning system. Automatic notification and alert features allow users to receive updates when abnormal conditions occur.
For example, if a machine’s temperature exceeds a defined threshold, the system will immediately send a notification so that prompt action can be taken.
This feature helps companies reduce the risk of damage and downtime. Notifications can also be customized so that users only receive relevant information.
With an alert system in place, monitoring becomes more proactive rather than purely reactive.
Ease of Access and System Scalability
Read Also : Optimizing Cultural Heritage Security: How Access Sensors Protect Sites and Collections
The Flux Dashboard is designed for easy access across multiple devices, including desktops, tablets, and smartphones. This allows users to monitor operations anytime and anywhere.
This accessibility is especially important for companies with multiple operational locations. Management can monitor all activities without needing to be physically present.
In addition, the Flux Dashboard offers high scalability. The system can be expanded according to company needs, whether in terms of the number of devices or data complexity.
As the company grows, the dashboard can be continuously adapted without replacing the existing system, providing flexibility for future development.
Conclusion
The Flux Dashboard is an effective solution for real-time and accurate IoT data monitoring. With advantages such as informative data visualization, system integration, high data accuracy, and automatic notification features, it helps companies improve operational efficiency.
Its ease of access and scalability also make the Flux Dashboard a suitable choice for various industries. With proper implementation, it can become a crucial tool in supporting digital transformation.
In today’s rapidly evolving digital era, using dashboards like Flux is no longer just an added value—it has become a necessity to ensure operations run optimally, transparently, and in a data-driven manner.